The Null Device
Posts matching tags 'statistics'
2009/11/12
Correlation of the day: Rock music quality and US crude oil production, by year; more precisely, "rock music quality" consists of number of songs in Rolling Stone Magazine's list of greatest songs of all times:
There's more on the theory here.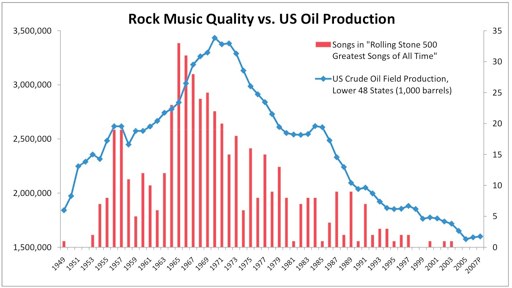
Notice that after the birth of rock & roll in the 1950’s, the production of “great songs” peaked in the 60’s, remained strong in the 70’s, but drastically fell in the subsequent decades. It would seem that, like oil, the supply of great musical ideas is finite. By the end of the 70’s, The Beatles, Led Zeppelin, Black Sabbath, the Motown greats, and other genre innovators quickly extracted the best their respective genres** had to offer, leaving little supply for future musicians.The graphs don't line up precisely, of course, though follow a similar arc.
The correlation may initially seem spooky, and invites outré speculation about the relationship between Rockism and Hubbert's Peak Oil theory and whether, as the Rockists would have us believe, we passed Peak Rock in the mid-1960s and have been in decline ever since. However, there is a more prosaic explanation; one which, in retrospect, seems obvious and somewhat boring.
The cultural phenomenon of rock'n'roll (at least in the classic sense that is venerated by the likes of Rolling Stone) was a product of the economic factors of its time, such the rise of the modern teenager, with disposable income and the freedom from harsh adult responsibility to identify along generational and subcultural lines, which were a result, in part, of an abundance of cheap oil. When one looks at it from this angle, one finds other correlations: the rise of plastics (made from oil), suburban sprawl, car culture (it's little surprise that the teenagers of the baby-boom era were about cars, from big ol' Cadillacs to hippie VWs, the way today's teens are about iPhones and social networks; witness the references to cars, and to making out in the backs of them in drive-in cinemas and such, in classic rock songs). Rock'n'roll in its classic sense was very much a product of the economic factors of cheap oil.
(via Boing Boing) ¶ 3
2008/2/28
French broadsheet Le Monde has published a map of the popularity of various social network sites across the world.
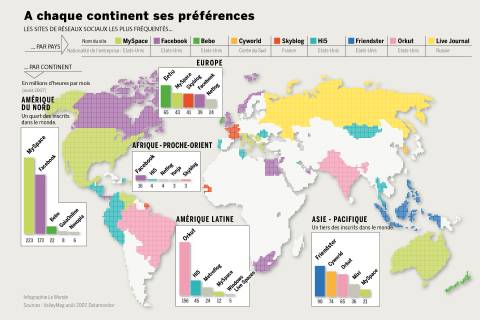 This map reveals that MySpace dominates in the USA and Australia, whereas the UK, Canada and Norway prefer Facebook. Which brings to mind the statistics about average IQs of countries, which place the UK's average at 100 and the US and Australia's at 98.
Interestingly enough, the chart lists LiveJournal as a Russian website, despite the fact that it began in, and operates out of, the US, though Russia has been a significant market for it and is now owned by a Russian concern.
2007/11/2
As the Australian election approaches (capsule summary: the Tories look set to be wiped out, much as they did in the previous two elections), the ABC's Bob Ellis (presumably a leftwinger who evaded the purges) claims that Rupert Murdoch's polling organisation manipulates its own results by timing its polls, technically without actually doing anything fraudulent:
Newspoll is not called 'the Fox News of statistics' for nothing. Like Fox News, it serves Rupert Murdoch. Like Bill O'Reilly, it tells him what he wants to hear. And what does Rupert Murdoch want to hear? Well, that the voters are very volatile, for one thing. The Labor numbers go up to 58 before the Great Debate, then down to 54 after it. On the weekend when, in the greatest gatherings in human history, the West protests against the Iraq war, and it's known that most Australians oppose it, the vote for Howard goes up. When he's found to have lied about Children Overboard, the vote for Howard goes up. When Howard seems on his last legs, he gets the good news he needs. From Newspoll, the preferred Murdoch pollster.
And like Newspoll you ring no mobile phones, thus eliminating or minimising, the Labor-leaning, or Green-leaning, under-38s. Like Newspoll you ring homes on Friday night, when the under-38s aren't home, but the old, the ill, the friendless, the poor and the mad are, the Howard battlers, the Menzies limpets, the One Nation crazies in socks and sandals. And you make them one-third of your figure.
How is I know, or I suspect, this is what they do? Well, I noticed the Labor vote always plummets, according to Newspoll, at the beginning of the Christmas holidays, and soars at the end of them, and it has for the last ten years. Is this because people think of John Howard over the plum pudding and decide that they love him? No. It's because the Labor vote, or the prosperous, educated Labor vote, aren't home. They're at the Sydney Festival or on a boat on the Hawkesbury or in a hotel in Byron Bay or a pensione in Venice whereas the old, the ill, the friendless, the poor and the mad are at home, as usual, waiting for Newspoll to engage them in detailed conversation. And so it is the Labor vote goes down at Christmas, and up again after Australia Day.
2006/5/18
A recent paper, A Corpus-based Approach to Finding Happiness (PDF) attempts to find a recipe for happiness, through the analysis of words in mood-tagged LiveJournal posts:
Our study is based on a collection of blogposts from LiveJournal.com, annotated with happy and sad moods. Every blog community practices a different genre of writingâ from our experience, LiveJournal.com blogs more closely recount the goings-on and happenstance of everyday life than any other blog communityThe study looked at both words and posting times, and used Bayesian techniques to find patterns, and compared the findings against a similar word ranking named ANEW, based on clinical studies, coming up with some interesting (and sometimes surprising) conclusions:
For instance, a topic that is often talked about in relation to happiness is love. In fact, looking up the ANEW list of words, love ranks the third out of 1034 words, with a high 87.2 pleasure factor. Instead, the word love in our list is neutral, with a happiness factor of only 48.7. Moreover, a morphological variation of the same word, loved, is ranked similarly high in the ANEW list (86.4), but it is marked as a sad word in our list (28.1). The only happy variation of this word is lovely, which has a happiness factor of 77.3 (this word does not appear in the ANEW list). What these rankings suggest is that the stereotypical view of love (the public view) is that of a happy word (the ANEW ranking), but the more private view of this word is neutral, due to a balanced distribution of this concept in both happy and sad moments.
There are also several examples of words in our list that have a high happiness factor, and yet they are not even listed in the ANEW list of words. For instance, shopping (79.5) and bought (69.9), are two of the highly ranked words in our list. Similarly, food related events (lunch (73.1), dinner (72.1) food (65.0), drink (64.4), etc.) have a high happiness factor, with only two of these concepts (dinner and food) being mentioned in the ANEW list. Another interesting example that has a positive happiness load in our list is drunk (59.1), which is most likely not one of the most widely publicly admitted states of happiness.
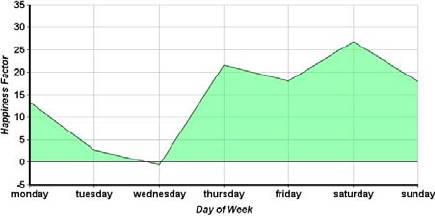 The study also charted the occurrence of happiness by time of day and week (finding that happiness is at a low at around 8am, as people are wrenched from their blissful sleep to face the drudgery of the world), and peaks at 2-4am (presumably because of the nocturnal habits of LiveJournallers); on a weekly chart, happiness peaks on Saturday and then dives, reaching a low on Wednesday before climbing back for the weekend. Which shows that anticipation plays a big part in one's immediate happiness.
Other observations in the paper: sad posts include more actions (presumably because of a tendency to write about bad things that happened) and "human-centred" words (the latter presumably because depression involves thinking about one's woeful lot in life, whereas happiness doesn't), whereas happy posts include more descriptions of things and "social" words. Also, the study answers Jens Lekman's question about birthdays in the affirmative, with the word "birthday" having a high happiness score. And whilst loving a person is likely to make one sad, loving a thing makes one happy, because we've all got a little bit of Gollum inside:
A large fraction of the bigrams with low happiness factor are centered around humans, i.e. miss you, I hate, I wish, for him, you were, etc. An observation in the same vein can be drawn from the ranking of three-grams, where facts revolving around love are related to humans in the top sad three-grams, I love him (37.33), I love you (37.09), but refer to objects in the three-grams with high happiness factor: I love it (85.00), I love the (82.85), I love that (68.62). This reinforces the findings from the previous section, which showed that expressions of sad feelings are more often human-centered than the happy feelings.The authors conclude with a recipe for happiness, based on their findings:
Go shop for something new — something cool, make sure that you love it. Then have lots of food, for dinner preferably, as the times of breakfast and lunch are to be avoided. Consider also including a new, hot taste, and one of your favorite drinks. Then go to an interesting place, it could be a movie, a concert, a party, or any other social place. Having fun, and optionally getting drunk, is also part of the recipe. Note that you should avoid any unnecessary actions, as they can occasionally trigger feelings of unhappiness. Ideally the recipe should be served on a Saturday, for maximum happiness effect. If all this happens on your birthday, even better.