The Gini coefficient is a number from 0 to 1 representing the equality or inequality of income distribution in an economy; 0 is theoretical absolute equality, and 1 is one person having everything and everyone going without. In practice, it varies from about 0.2 to about 0.7.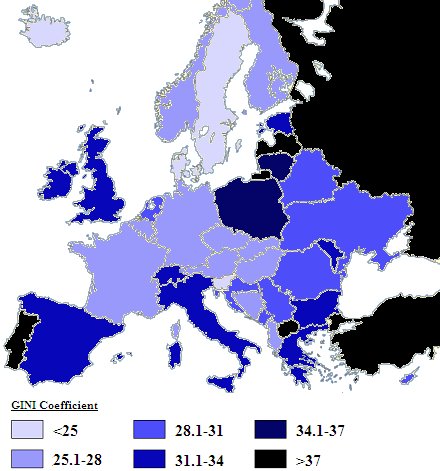
According to it, Europe ranges from the mid-.20s to the high .30s, with a few outliers in the low 40s. At the most egalitarian end, unsurprisingly, are the Jante states of Denmark and Sweden, as well as Iceland (perhaps surprisingly, if it's meant to have been an experiment in cut-throat neoliberalism). Things get more inequitous into Norway, Finland, France, Germany and Switzerland (which stays under .28, despite being home to a lot of the global super-rich), and then on to Italy, Spain, Britain and Ireland, and beyond that, Poland and Lithuania. The most unequal country in Europe is Turkey, which has a Gini coefficient of 0.436, somewhere between Guyana and Nigeria, or, if you prefer, Delaware and Hawaii.
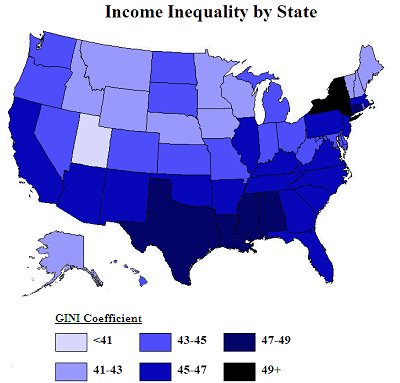
The United States is, unsurprisingly, a lot less egalitarian in income than Europe. American states' Gini coefficients range from 0.41 (the solidly Mormon state of Utah, whose state emblem is the beehive, has a Gini coefficient equivalent to Russia's) to a whopping 0.537 in the District of Columbia (comparable to the Honduras). Other states are twinned with parts of the developing world; Alabama and Mississippi are most like Nepal, California has the income distribution of Rwanda, and New York, barely under the .5 mark, is twinned with Costa Rica. According to the article, this is an astonishing state of affairs for a developed country:
According the the CIA World Factbook (table compiled here), the lowest Gini score in the world is Sweden's, at .23, followed by Denmark and Slovenia at .24. The next 20 countries are all in either Western Europe or the former Communist bloc of Eastern Europe. The EU as a whole is at .307. Russia has the highest number in Europe (.41); Portugal is the highest in Western Europe (.38). Japan is at .381; Australia is .352; Canada is .321.
And then there is the United States, sandwiched between Cote d'Ivoire and Uruguay at .450. Not counting Hong Kong (.523), the US is a complete loner among developed countries. In fact, as you can see from the map above, there is no overlap between any single US state and any other developed country; no state is within the normal range of income distribution in the rest of the developed world. Here's a list of the states with their Gini index numbers, and the country where income distribution is most comparable in parentheses:Other interesting maps on the site include a map of religious nonbelief in the UK (which points out that Scotland and Northern Ireland are the most religious, and asks whether that correlates to the Scots-Irish roots of the US "Bible belt"), of antidepressant use in England and Wales (summary: it's grim up north, and in Cornwall too; either that or Londoners prefer a line of coke), and one suggesting that, as global warming advances, Australia is ecologically fux0red.
I hope someone appreciates the irony that the GINI index of the entire US is higher than any of Europe's functioning and sustainable 'social democracies' (including Russia) ---- although the color coding of the US chart and European chart suggests that there is some parity.
The US as a whole is 'off the charts' in high GINI (high inequality) with any other advanced industrial, so-called democracy --- and is only comparable to what used to be called South American banana republics' (most of which are now better than the US in GINI ratings, and with current African military dictatorships, and Middle Eastern plutocratic royal family oil monarchies.
In fact, at 0.49 and rising fast in GINI Coefficient, the US is closer to Robert Mugabe's autocratic dictatorship of Zimbabwe (at 0.53) than with any real democracy ---- which strongly suggests, that the US is not a democracy at all, but only a disguised ruling-elite 'corporate financial Empire'.